Data VisualizationData Science
Global iPhone Sales Dashboard
An interactive Arabic Power BI report answering five questions about iPhone sales across 48 countries from 2017 to 2025, built on a synthetic Kaggle dataset.
- My role
- Analysis, modeling and design (solo)
- Status
- Completed · not yet published to Power BI Service
- Period
- October 2026
Open in «Tahlil» No public repository
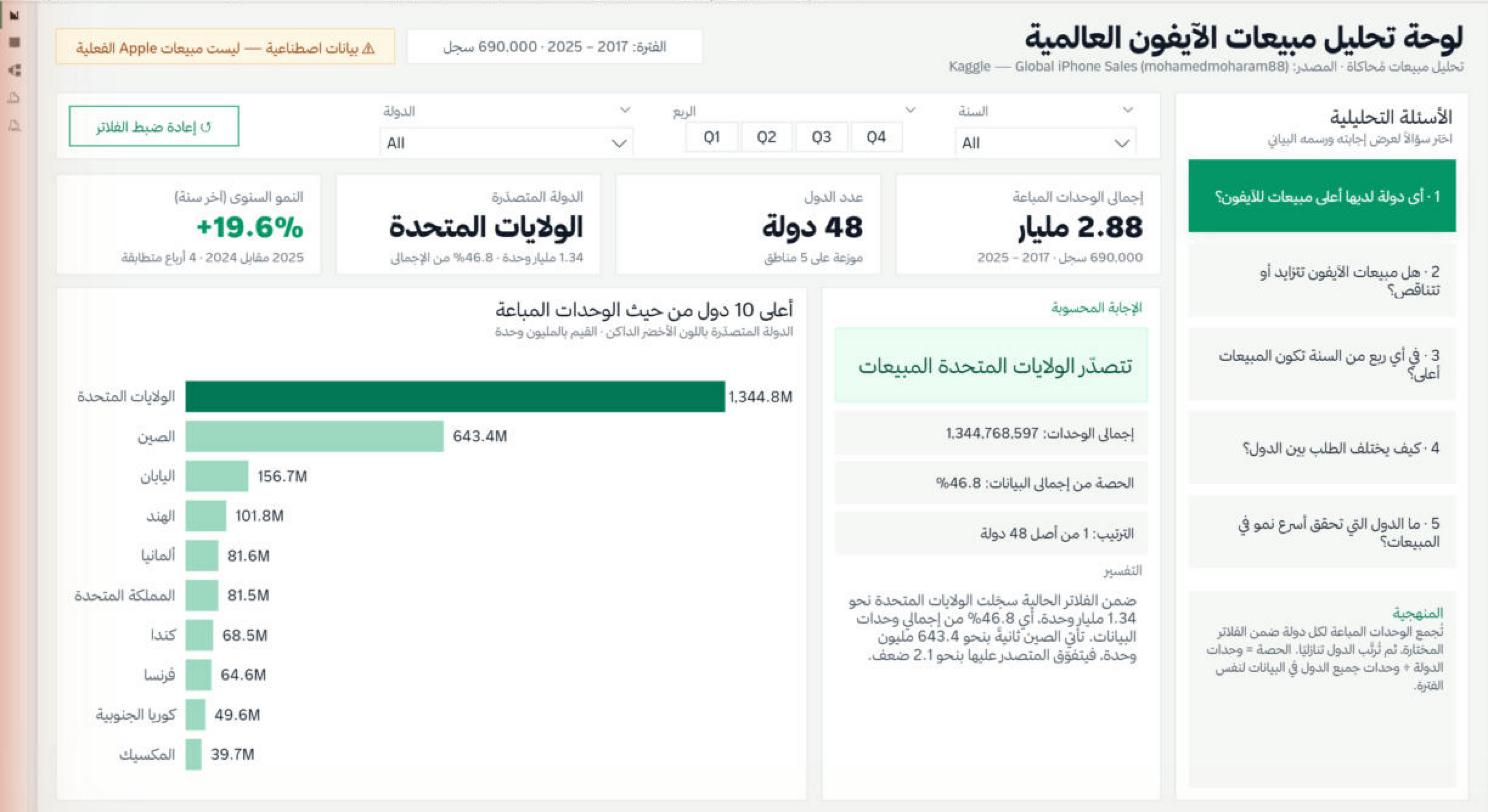
The data is synthetic (Kaggle) and does not represent real Apple sales.
01Overview
A five-page report, one page per question, with year, quarter and country filters that stay in place across pages, and Arabic answers that update with the filters.
02Problem
A large sales dataset (691K rows) needed cleaning and structure before it could answer clear questions, while avoiding misleading comparisons such as a partial year against a full one.
03Objective
Build an easy-to-read Arabic report answering: where most units sell, whether sales are growing, which quarter is strongest, how demand is spread, and who is growing fastest.
04My contribution
- Cleaned the data with Pandas: removed 1,035 duplicate rows without inventing any values.
- Designed a star schema and wrote about 70 DAX measures.
- Designed the full right-to-left Arabic interface in an emerald theme.
- Recomputed every answer in Pandas and compared it with Power BI.
05Technologies
- Power BI
- DAX
- Python
- Pandas
- TMDL / PBIR
06Architecture & implementation
- Python + Pandas: cleaning and building the dimension tables (period, country, model, channel).
- A Power BI PBIP project: the model in TMDL and the report in PBIR, both generated by script.
- The static «Tahlil» site (HTML, CSS, JavaScript) presents the answers with animated charts.
07Features
- Five question pages with question navigation and a reset-filters button.
- Year-over-year growth computed on matching quarters only.
- An adjustable minimum baseline that keeps small countries from topping the growth list with inflated rates.
- A demand map by country.
08Technical challenges
- Ordering Arabic text mixed with numbers inside DAX, solved with Unicode direction marks.
- Report buttons rendered blank because their show toggles need a specific PBIR format.
- File paths exceeded the Windows 260-character limit, so project names were shortened.
09Outcomes
- Every answer in Power BI matched the independent Pandas recomputation.
- The United States leads with a 46.8% share, and 2025 growth was 19.6%.