Web DevelopmentData Visualization
«Tahlil»: a data analysis showcase site
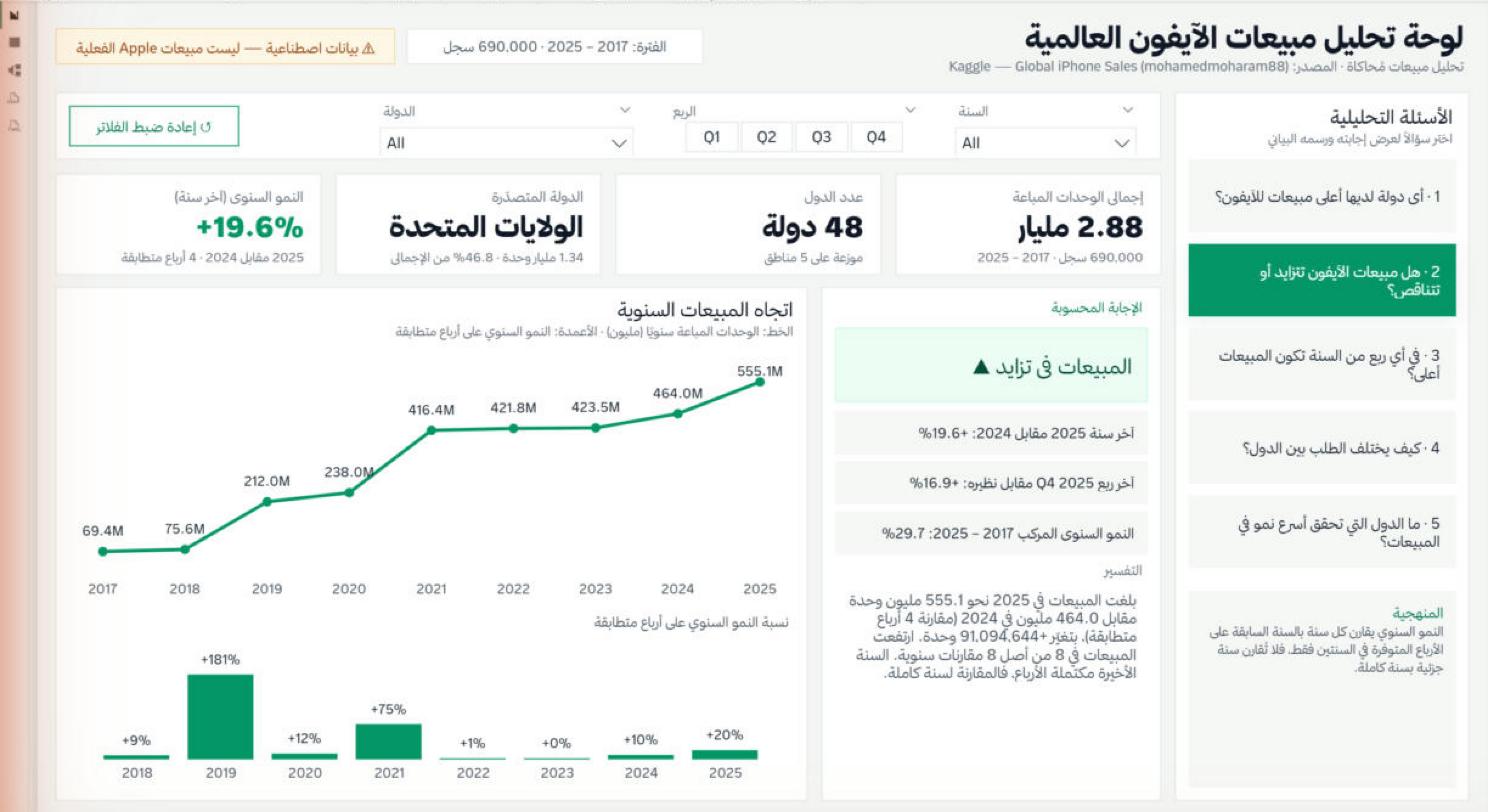
An Arabic site that lists analysis projects as cards, each with a details page of animated, interactive answers, in light and dark mode.
- My role
- Design and development (solo)
- Status
- Completed · runs locally
- Period
- October 2026
Open «Tahlil» No public repository
01Overview
A «Tahlil» home page listing projects, a page per project, and a separate page for Power BI screenshots.
02Problem
Power BI screenshots alone don't explain an analysis clearly and aren't interactive on the web.
03Objective
Present each question's result as a live analysis: counting numbers and bars, columns, lines and donuts that animate and respond on hover.
04My contribution
- Designed the Arabic interface with rounded corners and the Thmanyah and Ubuntu fonts.
- Wrote animated SVG charts from scratch, with no libraries.
- A simple data structure so new projects are added from one file.
05Technologies
- HTML
- CSS
- JavaScript
- SVG
06Architecture & implementation
- Static HTML pages built from a single projects.js file.
- SVG charts and CSS transitions that respect the reduced-motion setting.
07Features
- Light and dark mode that follows the device setting.
- Project filtering by category.
- A ready slot to embed the Power BI report once it's published.
08Technical challenges
- Ordering Arabic text and numbers inside SVG charts on a right-to-left page.